Knowledge Graph
A force-directed, pannable, zoomable map of the connections you've recorded between entries — built to pair with a relationships table field, so citation and cross-reference work (research notes, a dossier, a linked wiki) gets a visual instead of staying a flat list.
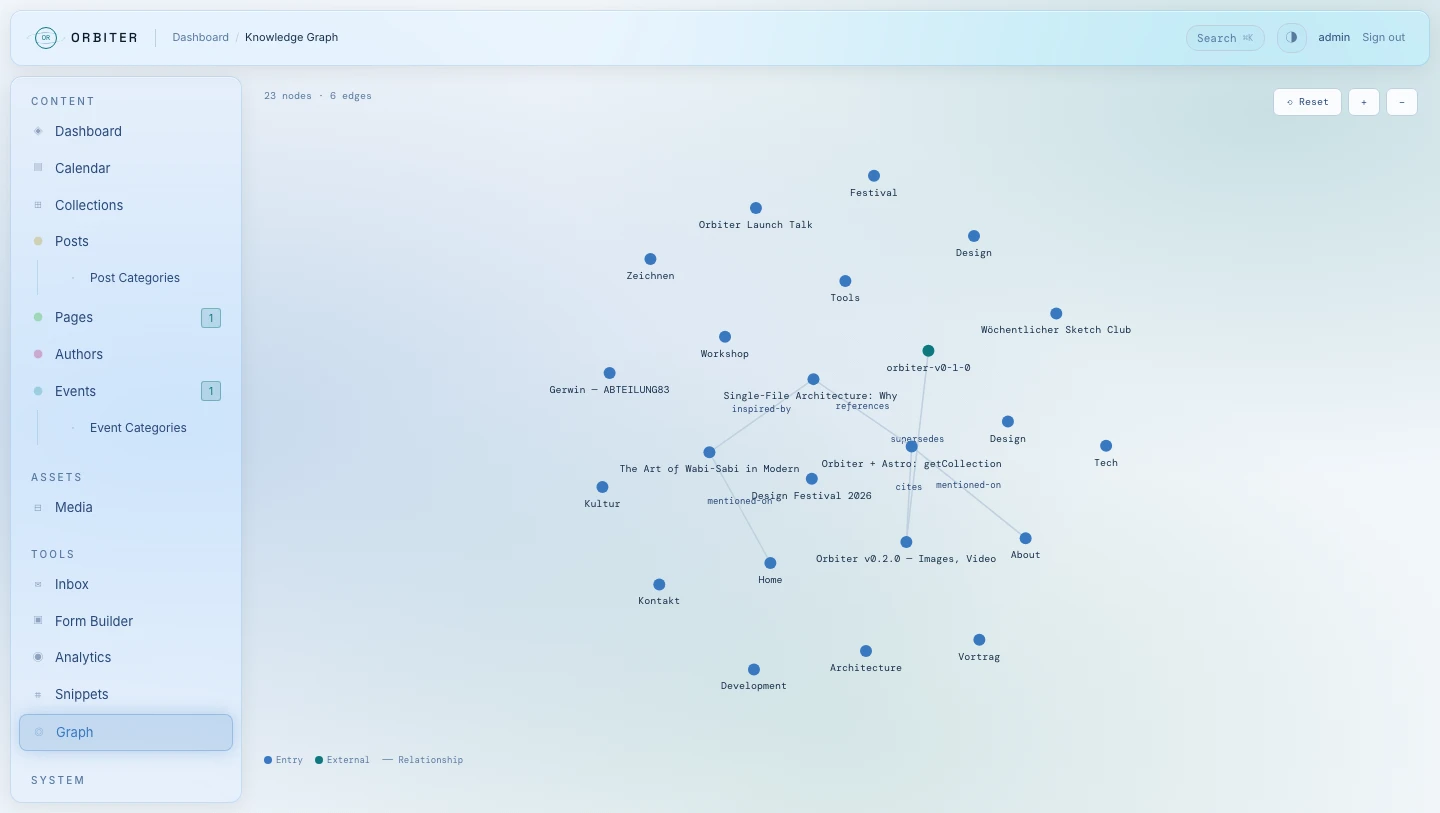
Where to find it
Graph in the sidebar. It builds the map on load by scanning every collection's entries for a field literally named relationships, so it reflects whatever's actually filled in right now — nothing pre-computed.
Setting it up
Add a field of type table named relationships to any collection's schema (Schema in the sidebar). Each row is three columns:
| Column | Meaning |
|---|---|
from | Slug of the entry the relation starts at |
relation | Free-text label — "cites", "responds to", "supersedes", whatever fits |
to | Slug of the entry (or external reference) the relation points to |
The Dossier template (Tools → Templates) ships with this field pre-configured if you'd rather start from that than build the schema by hand.
Reading the graph
- Accent-colored nodes — entries that exist in this pod. Labeled with their collection underneath.
- Gold nodes — a
from/toslug that doesn't resolve to an entry in this pod. Still shown, so a typo'd slug or a reference to something outside the pod is visible instead of silently dropped. - Labeled edges — the relation column's text.
Controls
Drag to pan, scroll or use the + / − buttons to zoom. The layout is a live physics simulation — nodes settle into place and gently repel each other, so dense clusters spread themselves out instead of overlapping.